TouchMusic
2019
Individual project
Duration
2 weeks
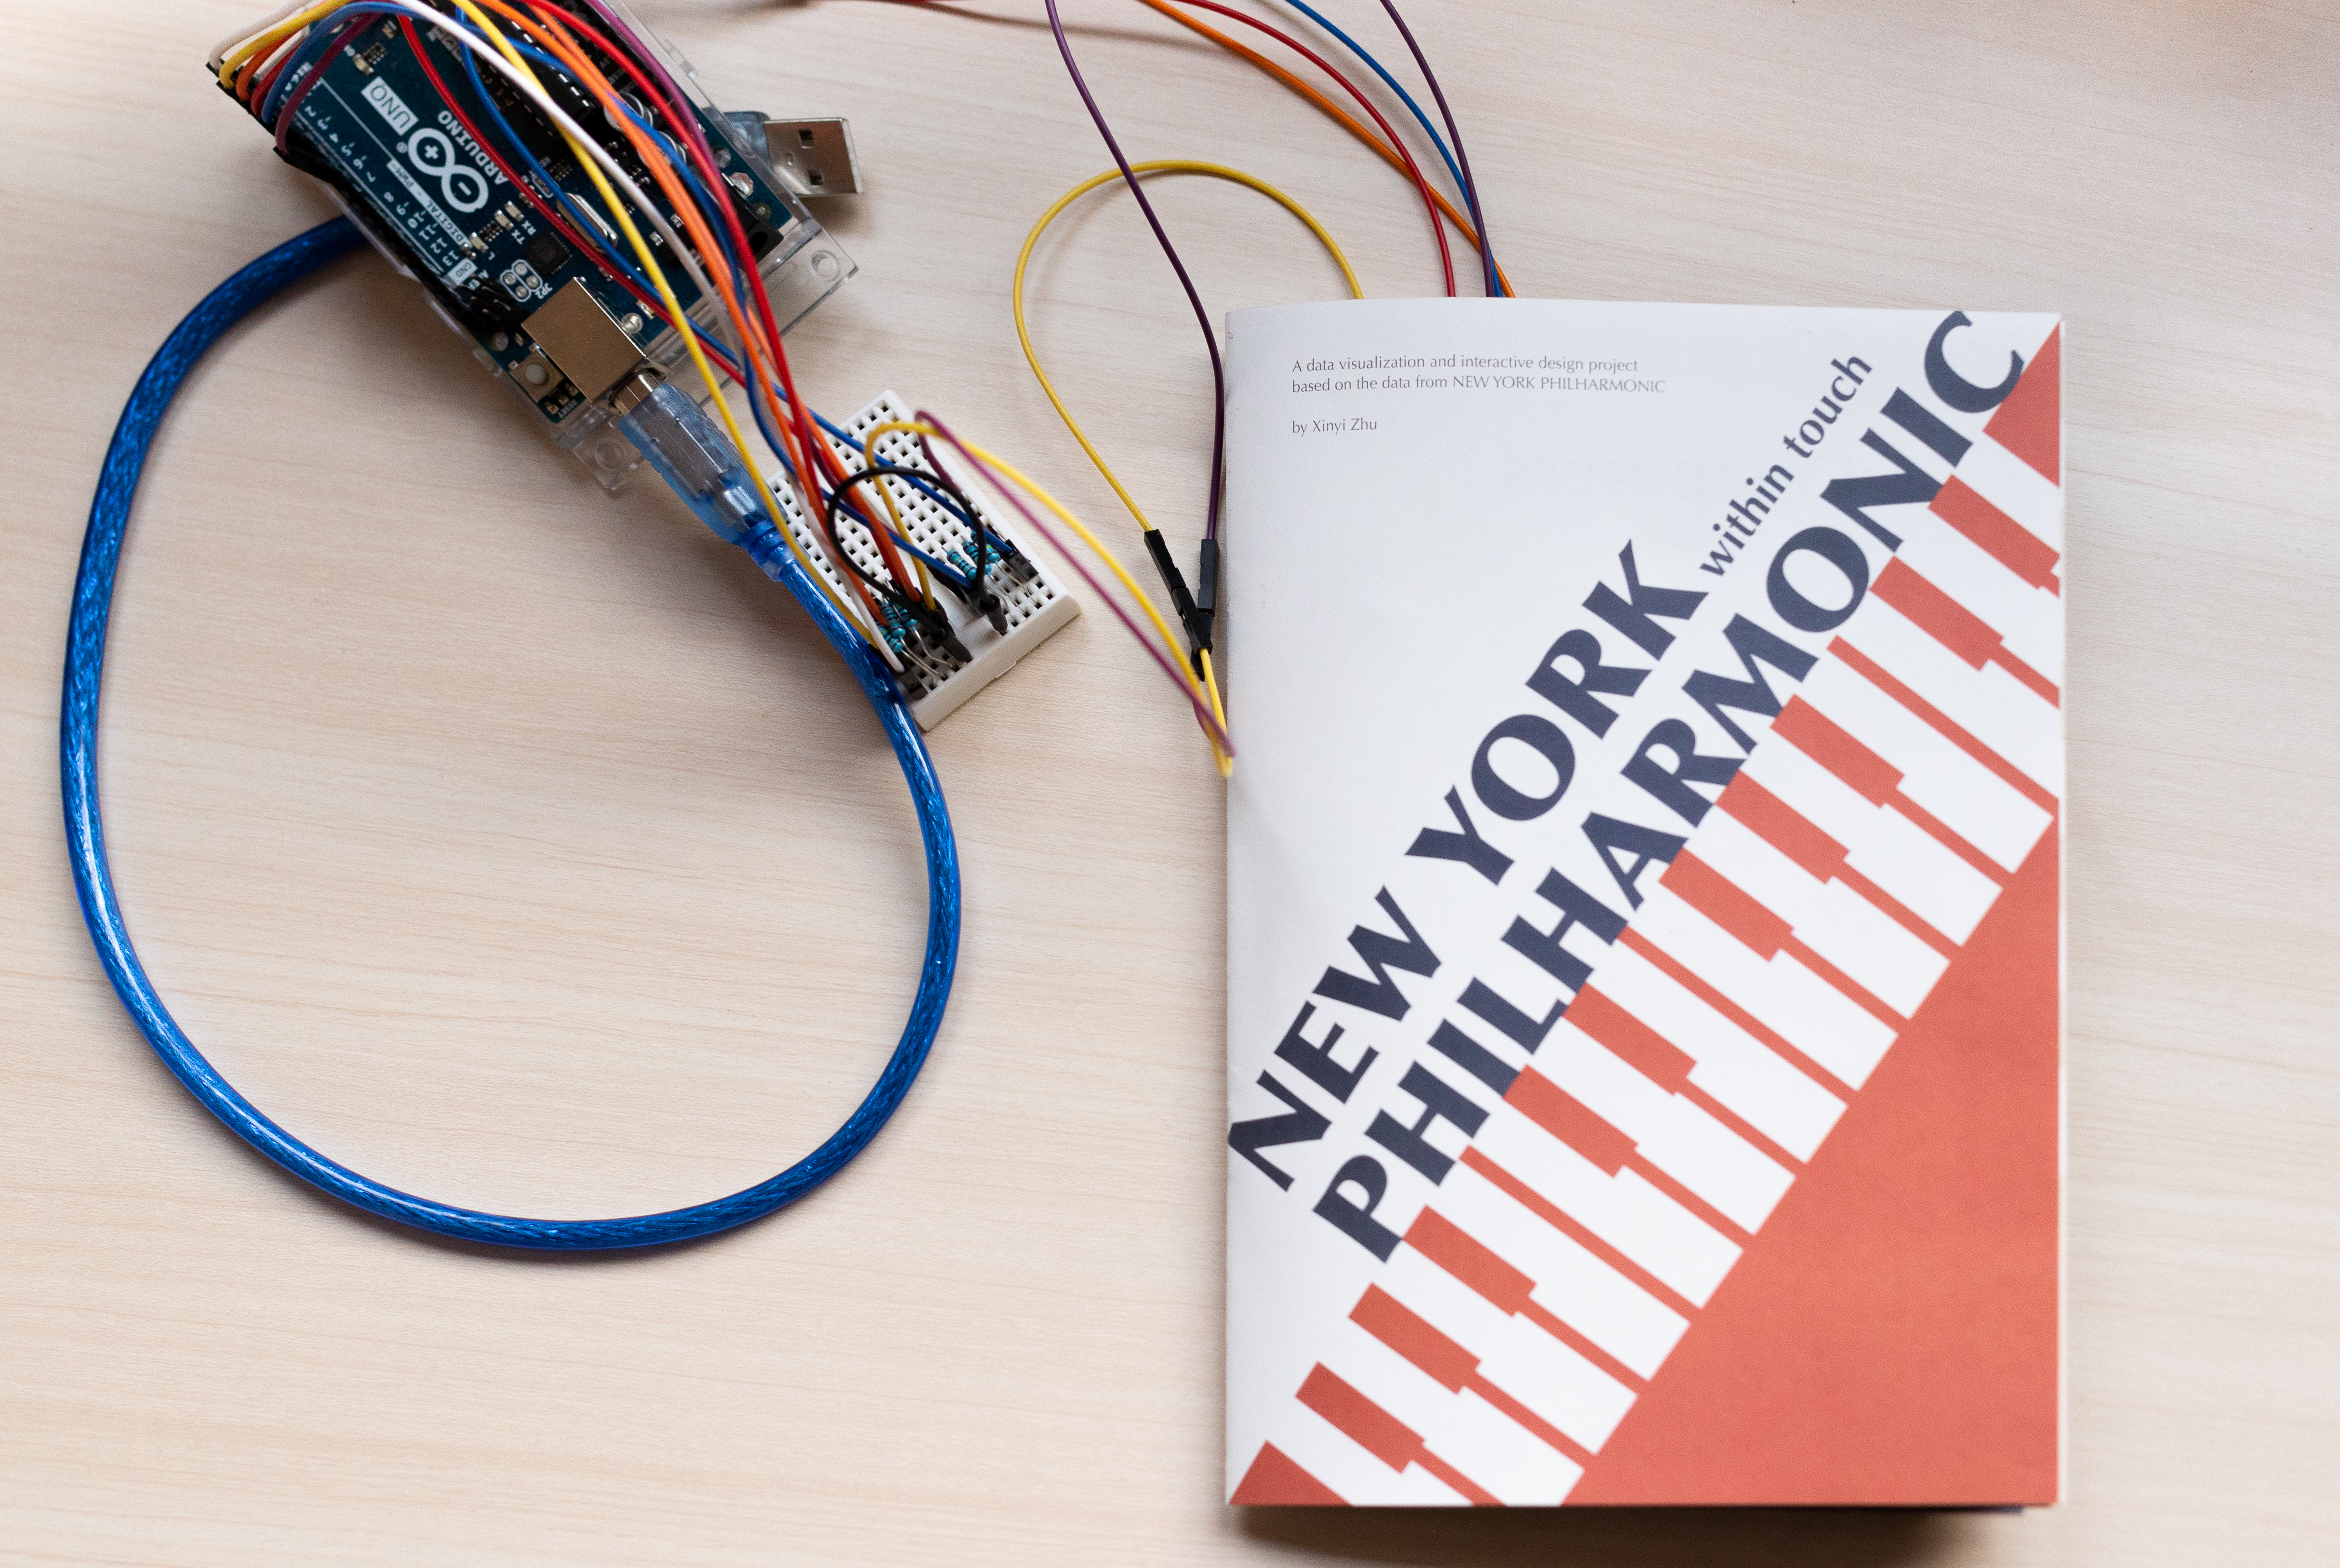
The database of New York Philharmonic's performance history documents all known concerts of New York Philharmonic and contains more than 20,000 performances, dating back to the first concert in 1842. As a classic music lover, I created a series of data visualization that unveils the historical stories behind the dataset and allows digital interaction with the music through touching the corresponding graphics on the book.
![]()

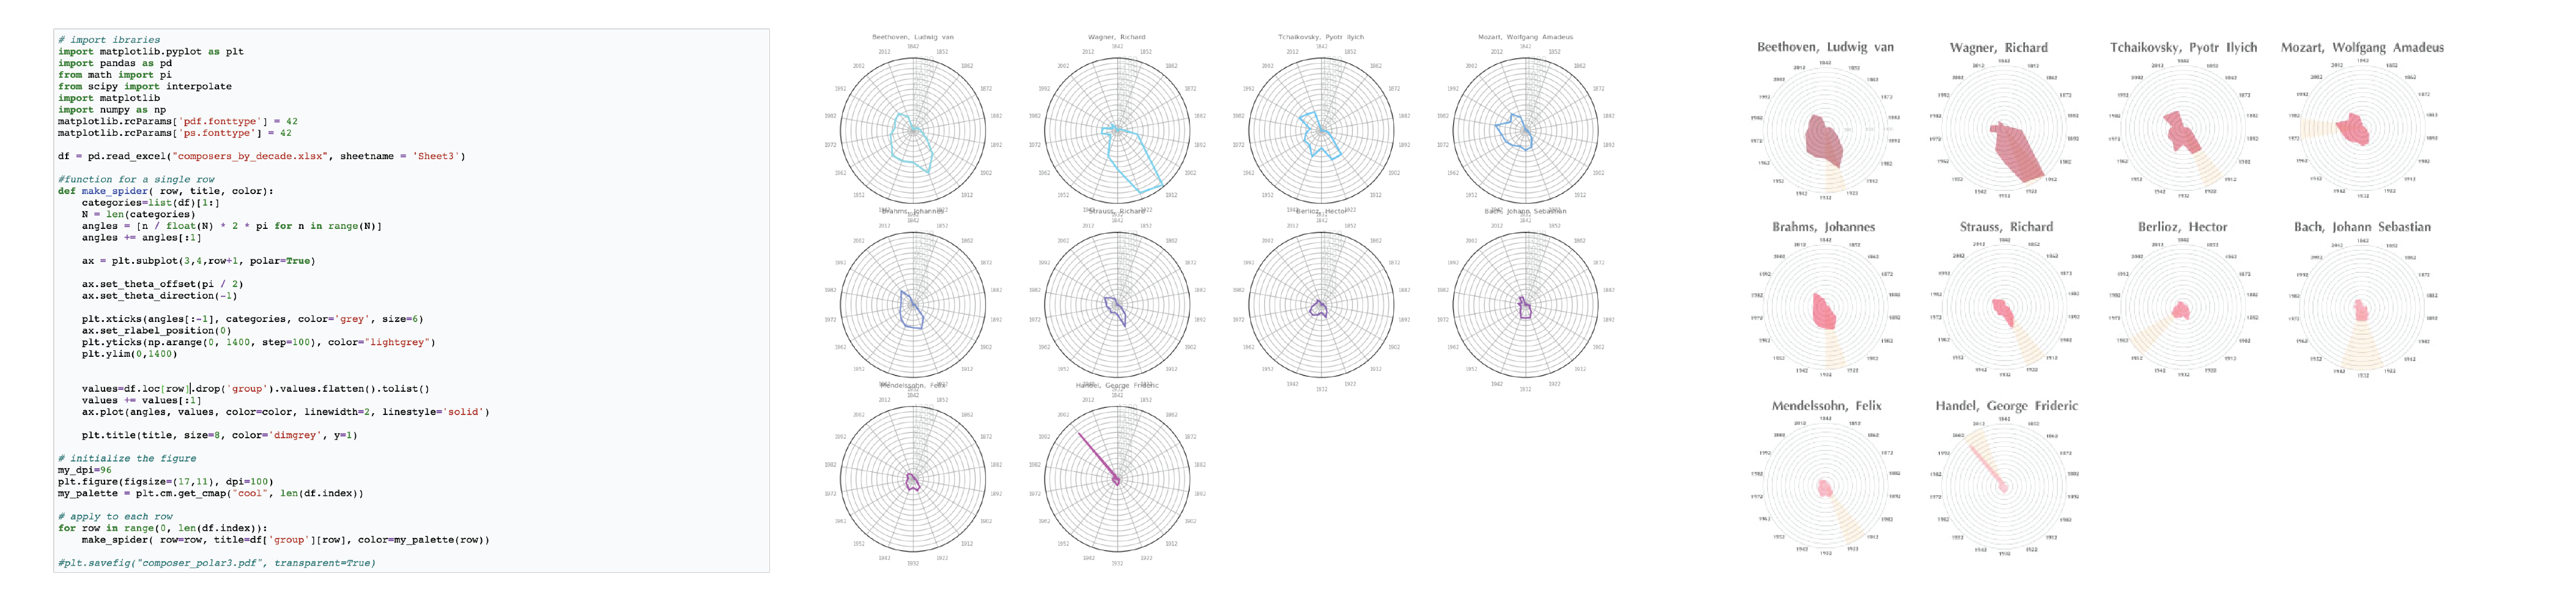
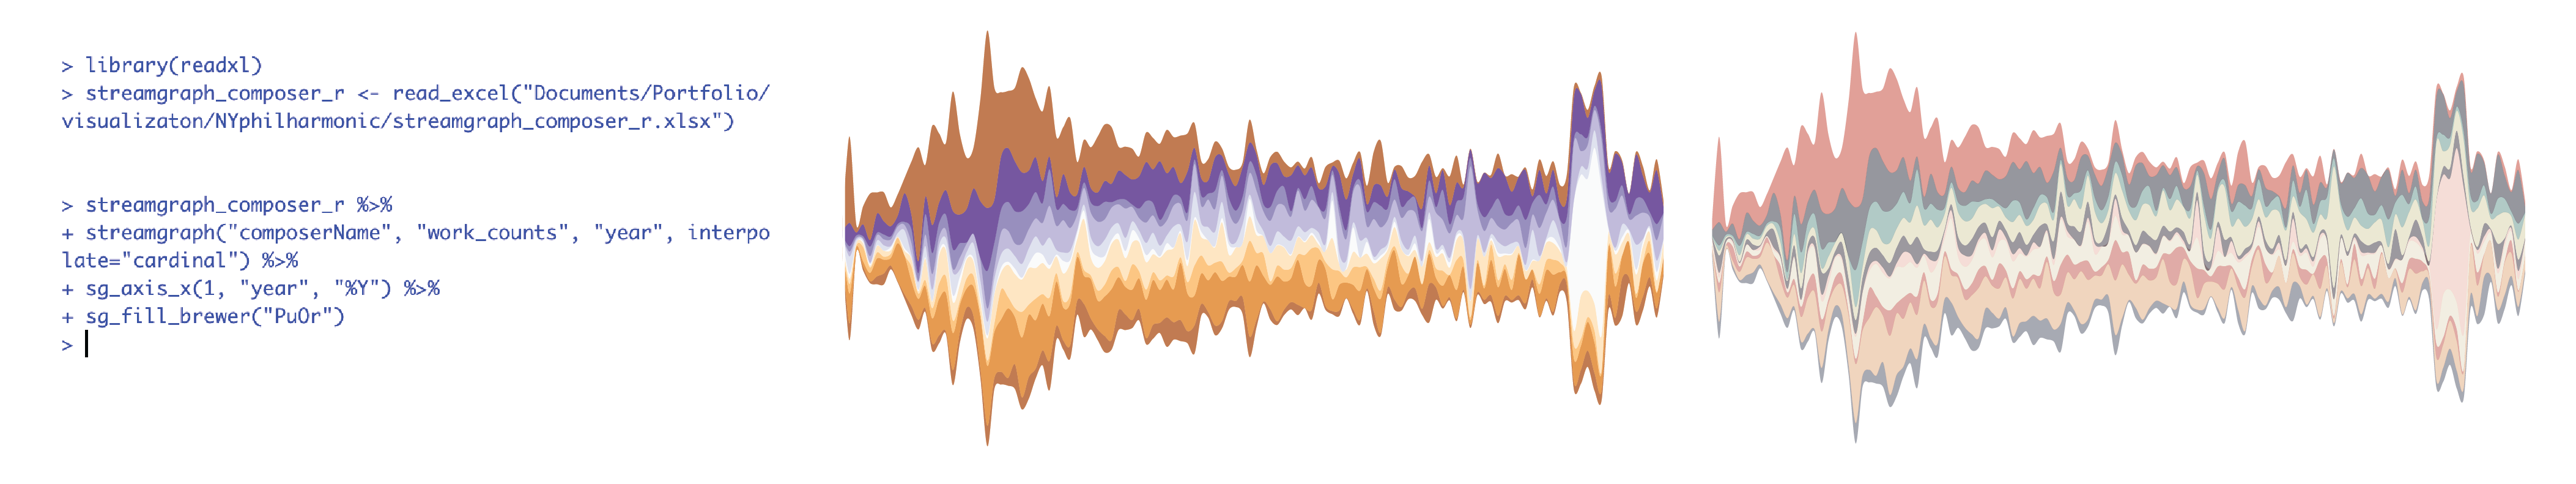
DATA VISUALIZATION
The metadata is available in JSON format. I used Python for data processing and started playing with the dataset in pandas. I further used Matplotlib (in Python), R and Illustrator for data visualization. Here are two examples of the data visualization process in Python and R.
![]()
![]()
BOOK DESIGN

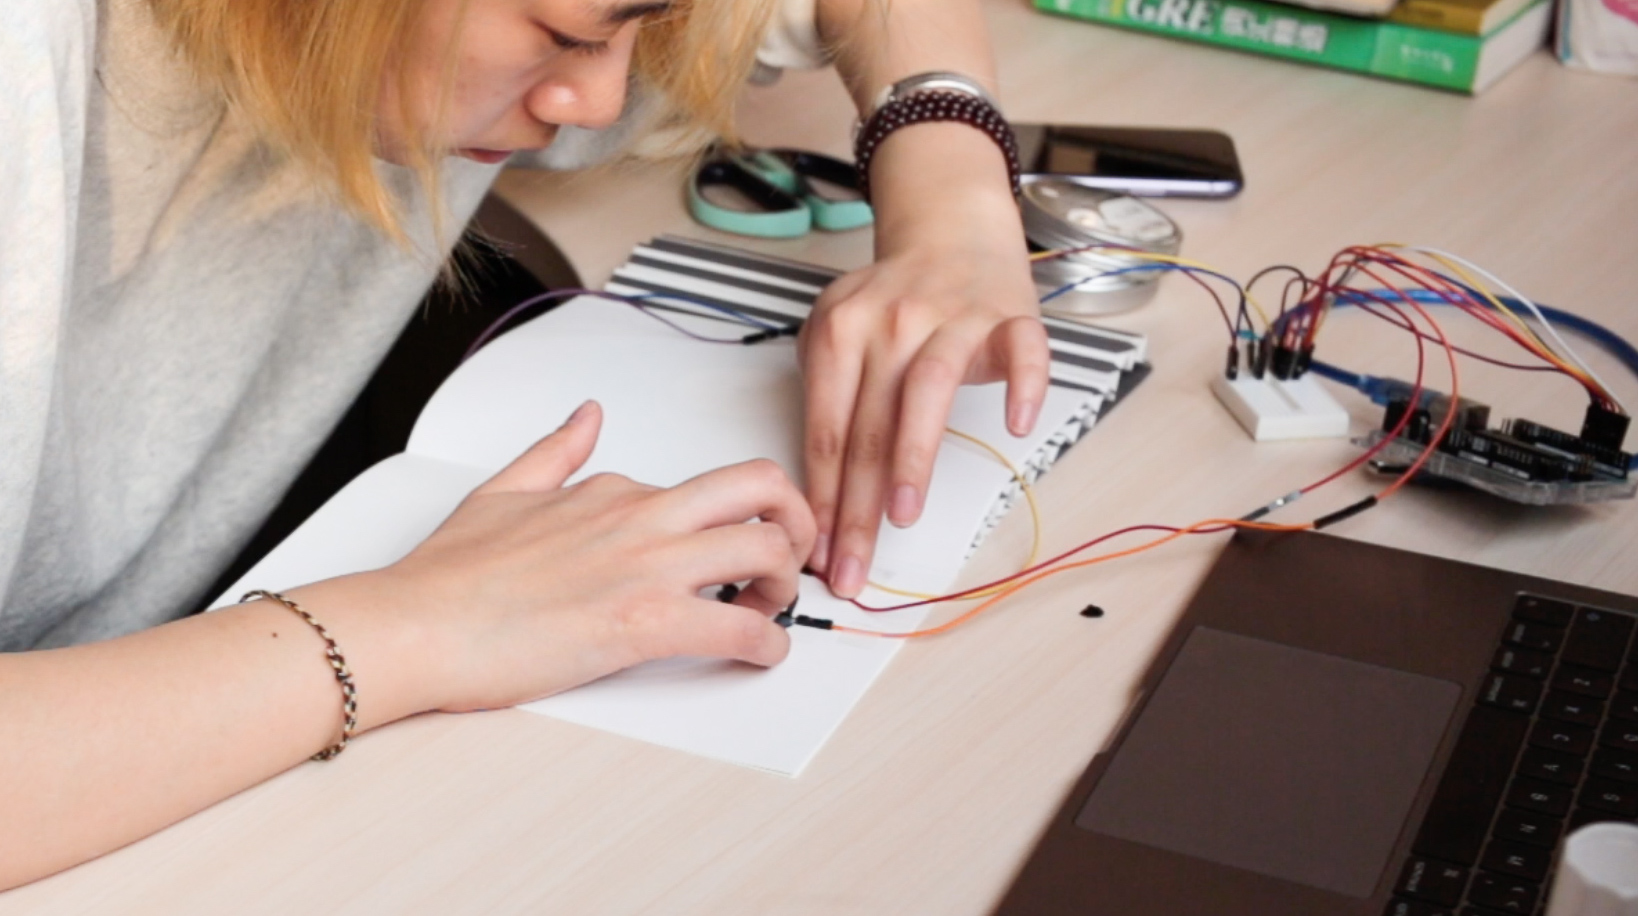
INTERACTION DESIGN
User flow 1
User can interact with the book in the same way as people use an accordion.
User can interact with the book in the same way as people use an accordion.

User flow 2
User can trigger music through touching the corresponding graphical information.
User can trigger music through touching the corresponding graphical information.

MAKING PROCESS


FINAL OUTCOME